- Install Plugin Pro-filer in the plugin registration Tool.(if you don’t find this option, download latest SDK)
- Now Register the plug-in and step on the Microsoft Dynamics CRM server. Keep a copy of the debug compiled plug-in assembly on the computer where you are running the tool(@SDK\sdk\tools\pluginregistration\bin\Debug)
- Select a plug-in step and click Profile to enable profiling.
- Perform the operation in Microsoft Dynamics CRM that causes the plug-in to run. Ex: Here updation of Account which trigger the plugin
- Now the plug-in throws an exception and the Business Process Error dialog is displayed, click Download Log File and save this file.
- In the Plug-in Registration tool, click Debug.

- Debug Dialog will open
- select the Saved Error Log File in the “Profile Location” and then select the Plugin assembly location in the “Assembly Location” where .rdb file available to debug. select the plugin which needs to be debug in the “Plug-in” dropdown list.
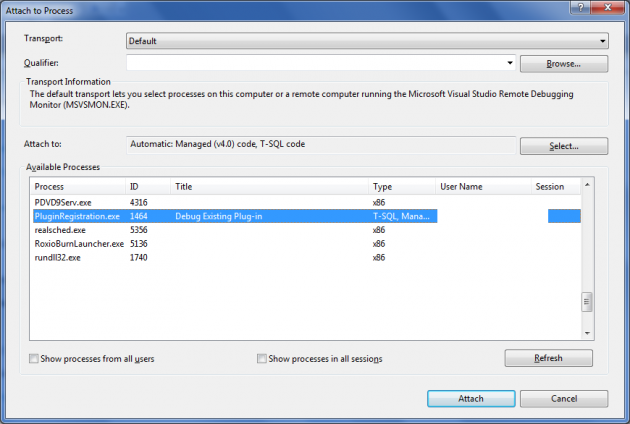
- Now open the plugin solution in Visual Studio and then place the break point to debug, attach the debugger to PluginRegistration.exe process

- Click Start Plug-in Execution in the Debug Existing Plug-in dialog box
- Now the debugger will start debugging from the break point in the VS. Now you can debug the plugin in the normal way like on-premise


No comments:
Post a Comment